
Social Data

The S in ESG has the same data problem as the E.

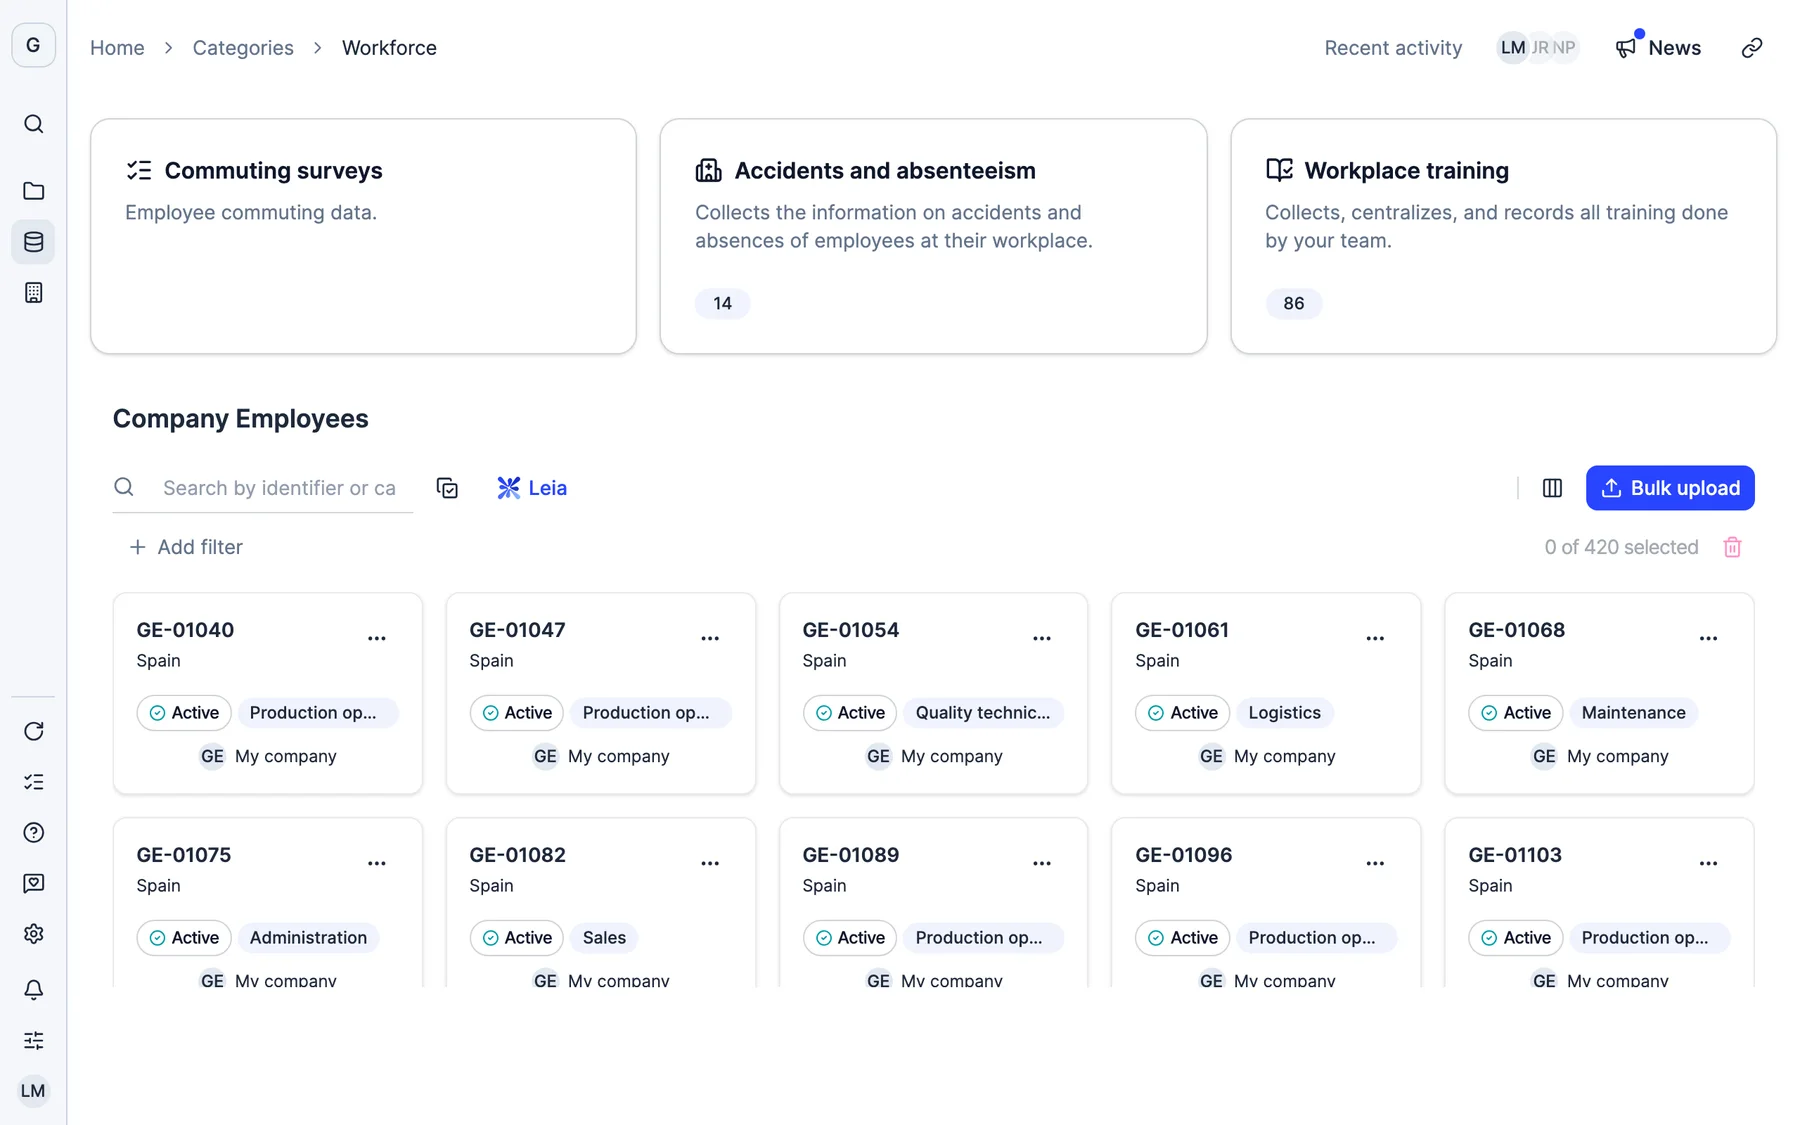
Remuneration, the gender pay gap, accidents, absenteeism, terminations and training hours are disclosures now, and most teams still assemble them by hand every year. In Dcycle own workforce is a data category like any other: pivot it on any dimension, and the Excel you download is exactly what is on screen, ready to drop into the report.

Request a demo
CSRD Progress68% complete
E1 Climate
92%
S1 Workforce
74%
G1 Governance
60%
E4 Biodiversity
35%
Recent activity
LG
Laura G. uploaded Scope 3 evidenceE1-6 GHG emissions · 2 min ago
MR
Miguel R. completed S1-6 data entryS1 Workforce · 15 min ago
AC
Ana C. modified G1-1 conduct policiesG1 Governance · 1h ago

Trusted by 2,000+ companies across Europe and North America, from SME to enterprise

ABB
Ajinomoto
Eiffage
KLN
Sabadell
Valeo
14 tables, one click

of own workforce visualisations created for an EINF or GRI project.

Own workforce, as a data category

The social disclosures, built from the records underneath

A pay gap computed from the data, not averaged from a table

The remuneration and wage gap category gives you three measures across five hierarchies: company, year, country, gender and job category. The gap is computed from the underlying employee records at every level, so a country or group total reflects the real FTE weighted gap instead of averaging the averages you can see. Toggle between calendar and fiscal year, and switch between operational and financial, participation weighted, consolidation.

Remuneration & wage gapFY 2026
JOB CATEGORYWOMENMENGAP
Management72,40078,9008.2%
Technical41,15042,6003.4%
Operations28,90029,4001.7%
Group total39,28043,1108.9%
Weighted by FTE from the underlying employee records, not an average of averages

Accidents, absenteeism and terminations on the same footing

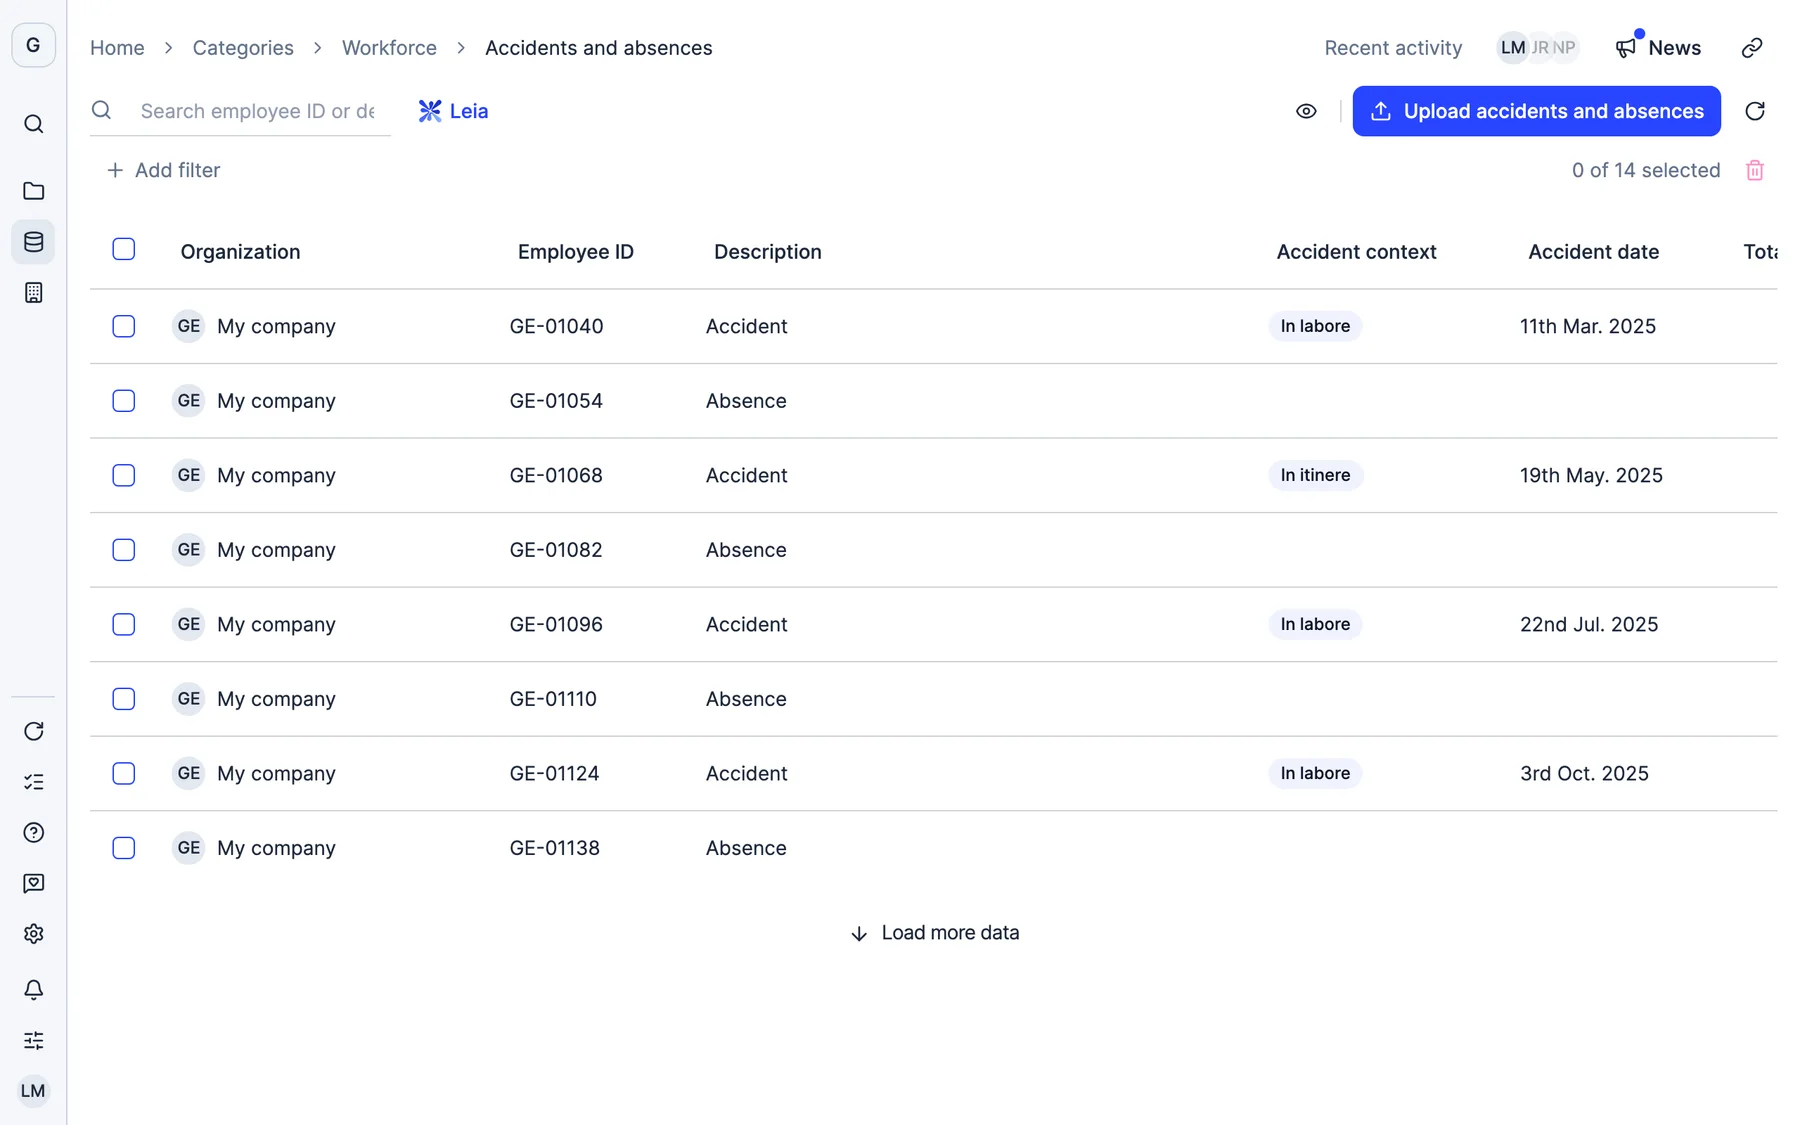
Occupational health and safety data pivots by site, period, incident type and severity. Terminations get a category of their own, counted in the month the contract actually ended rather than smeared across its duration, and broken down by gender, age, contract type, job category, labour agreement, country and end reason. Both have a participation weighted variant for group level consolidation.

Accidents & absenteeismMatches the Excel export
14Recordable
3.1Frequency rate
2.4%Absenteeism
Madrid plant · lost time6 · severity 2
Barcelona site · no lost time5 · severity 1
Logistics hub · commuting3 · severity 1
Drops into the GRI report as it isExport

Fourteen tables in one click for EINF and GRI

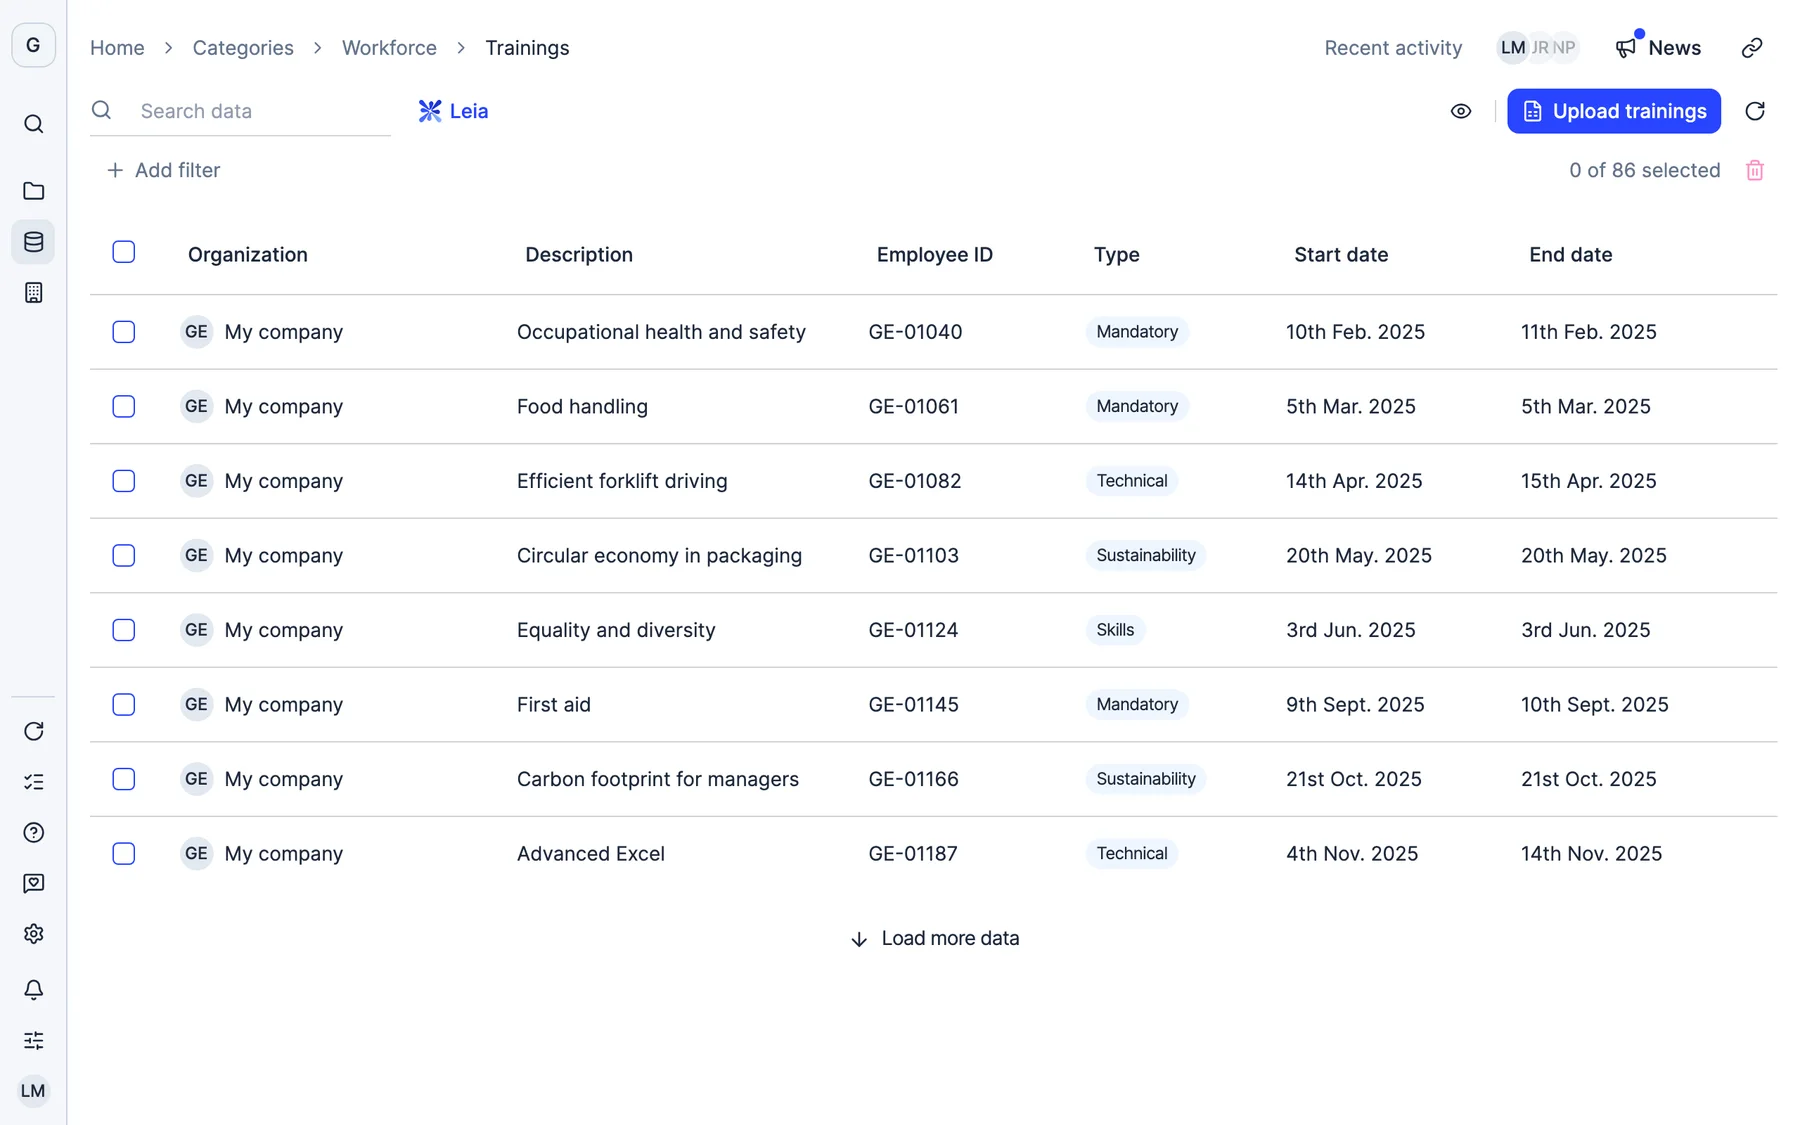
Own workforce visualisation templates create fourteen pivot tables at once inside an EINF or GRI project, so the first version of the social chapter exists before anyone opens a spreadsheet. Training hours for your own workforce have their own tables. From there you edit what you need instead of building from nothing.

Reports by Level
Download
GHG Protocol logo
Group Carbon FootprintAll entities · 486 tCO₂e
Ready
CSRD logo
CSRD — ConsolidatedGroup level · ESRS E1-E5
Ready
ISO 14064 logo
ISO 14064 — Madrid HQFacility level · Scope 1-2-3
Ready
EcoVadis logo
EcoVadis — GroupGroup level · Environment section
92%
One data entry → Every report, every level

Group structure, applied to people data too

The same consolidation that governs your emissions governs your workforce figures: choose which companies a report covers, and apply each subsidiary's ownership percentage when you report on a financial control basis. A holding with fifteen subsidiaries reports its pay gap once, at the level it actually files.

Organisation Structure+ Add entity
Acme Group · 3 countries
Spain
MG
100%
Madrid HQ
Barcelona
4 tasks42 files
France
LP
100%
Paris
Lyon
3 tasks18 files
Germany
AK
65%
Munich
Berlin
2 tasks12 files
Remuneration & wage gapFY 2026
JOB CATEGORYWOMENMENGAP
Management72,40078,9008.2%
Technical41,15042,6003.4%
Operations28,90029,4001.7%
Group total39,28043,1108.9%
Weighted by FTE from the underlying employee records, not an average of averages
Accidents & absenteeismMatches the Excel export
14Recordable
3.1Frequency rate
2.4%Absenteeism
Madrid plant · lost time6 · severity 2
Barcelona site · no lost time5 · severity 1
Logistics hub · commuting3 · severity 1
Drops into the GRI report as it isExport
Reports by Level
Download
GHG Protocol logo
Group Carbon FootprintAll entities · 486 tCO₂e
Ready
CSRD logo
CSRD — ConsolidatedGroup level · ESRS E1-E5
Ready
ISO 14064 logo
ISO 14064 — Madrid HQFacility level · Scope 1-2-3
Ready
EcoVadis logo
EcoVadis — GroupGroup level · Environment section
92%
One data entry → Every report, every level
Organisation Structure+ Add entity
Acme Group · 3 countries
Spain
MG
100%
Madrid HQ
Barcelona
4 tasks42 files
France
LP
100%
Paris
Lyon
3 tasks18 files
Germany
AK
65%
Munich
Berlin
2 tasks12 files

Additional features

See how Dcycle compares to the alternatives

Your choice Manual process Legacy tools

Remuneration and pay gap

Three measures, five hierarchies, calendar or fiscal year, and a gap weighted by FTE from the employee records at every level of the table.

Accidents and absenteeism

One configurable view by site, period, incident type and severity, built for the health and safety numbers a GRI or ESRS S1 chapter asks for.

Layoffs and terminations

Counted in the month the contract ended, split by gender, age, contract type, job category, labour agreement, country and end reason.

Training hours

In-house employee training as its own pivot category, so the training disclosure comes from the same place as the rest.

Operational and financial views

Every social measure carries a participation weighted variant, so group consolidation works the same way it does for emissions.

Excel that matches the screen

The download is a mirror of the view you built. It goes into the report without reformatting, which is where the errors used to come from.

“Dcycle helped us consolidate 6 facilities across 2 countries into a single source of truth. Our auditors couldn't believe the level of traceability.”
Lina Pena Corp. Services Director, KLN Iberia
“I see your help as super necessary, I can't imagine maintaining the contract without your advisory component. We went from scattered spreadsheets to a unified system in weeks.”
Yolanda Carazo Environmental Manager, Embutidos Monells
“Our investors value our ESG commitment. Dcycle made us a reference in the financial sector, we can respond to any audit or client request instantly.”
Teresa de Vicente Sustainability Lead, Finsolutia

Social reporting guides and resources

View all resources

Direct GRI traceability in your EINF data

Discover how each EINF datapoint now links to its corresponding GRI standard, with instant access to the exact page of the official document.

Read more

Frequently asked questions

Which social data can I report from Dcycle?

Remuneration and the gender pay gap, accidents and absenteeism, layoffs and contract terminations, and in-house training hours, each as its own pivot category over your own workforce. They are the figures an ESRS S1 or GRI social chapter asks for, and they behave like the environmental categories: same hierarchies, same consolidation, same export.

How is the gender pay gap calculated?

From the underlying employee records, not from the numbers displayed above. A parent level total, by country or by company, reflects the true gap weighted by the number of FTEs in each group, rather than averaging the averages in the rows you can see. That distinction matters, because an average of averages can move the reported gap by several points in either direction.

Can I report on a fiscal year that does not start in January?

Yes. The remuneration and wage gap tables toggle between calendar year and fiscal year grouping, so an organisation whose year starts in April reports on its own calendar rather than reshaping the data to fit ours.

How are layoffs counted?

Only contracts ended by termination, counted in the month the contract actually ended rather than spread across its duration. You can break them down by year, month, quarter, gender, age, contract type, job category, labour agreement, country and contract end reason, which is the granularity CSRD asks for on dismissals.

Does the export match what I see?

Yes, and it is the point. The Excel download mirrors the view you built, so the table goes straight into the sustainability report with no reformatting and no re-keying. That round trip through a spreadsheet is where most of the errors in a social chapter come from.

Does this work at group level?

Yes. Every social measure has an operational view and a financial one weighted by participation, so a holding consolidates its workforce figures the same way it consolidates emissions, and reports at the level it actually files.

Is this an HR system?

No, and it is worth being precise. Dcycle does not run payroll, manage contracts or replace your HRIS. It takes the workforce data you already hold and turns it into the disclosures a framework asks for, with the consolidation, the traceability and the export that reporting needs.

How does this connect to my EINF or GRI project?

Directly. Own workforce visualisation templates create fourteen pivot tables in one click inside an EINF or GRI project, and each data point in an EINF can be traced to its GRI standard with the compliance appendix generated automatically. The social chapter starts from something rather than from an empty document.

Collect once. Use everywhere.

See how Dcycle cuts reporting time by 70%, surfaces operational savings, and gives your auditors what they need, the first time.

See Dcycle in action