
Empreinte carbone

Impact Dashboard pour Cycle de vie Assessments

Luis avatar Luis · · 1 min de lecture
Impact Dashboard pour Cycle de vie Assessments

Photo by Pawel Czerwinski on Unsplash

Introducing the Life Cycle Assessment (LCA) Dashboard.

You can now analyze the environmental impact of your products in a visual, intuitive way: broken down by life-cycle stages according to the EN 15804 standard: raw materials (A1), transport (A2), manufacturing (A3), distribution (A4), operational energy use (B6), and operational water use (B7).

The dashboard includes:

  • Total impact with the corresponding unit of measurement
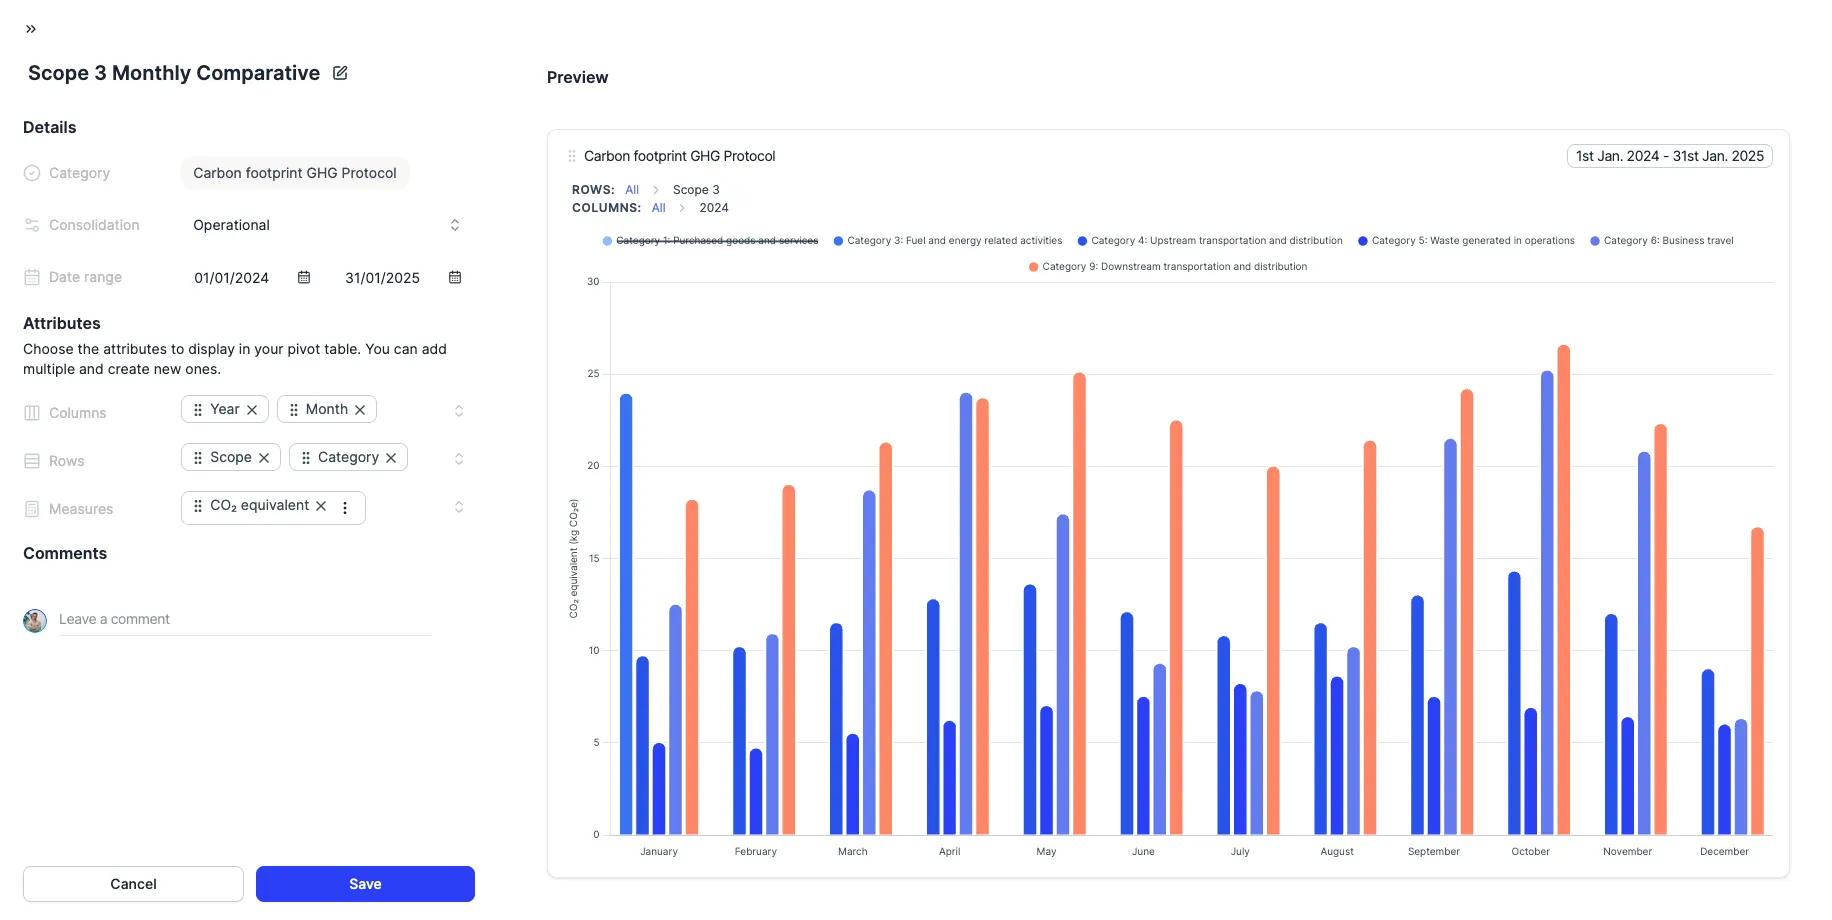
  • Donut chart showing the breakdown by life-cycle stage
  • Bar chart showing impact by product phase
  • Top contributors to impact in the production stages
  • Cross-filtering: click on any stage or phase to filter data across all charts Access the dashboard from the detail view of any LCA in your portfolio. You can switch between the dashboard and the calculation canvas at any time.
Product UpdateEmpreinte carbone
Démo de 30 minutes

Voyez-le avec vos propres donnees.

Trente minutes avec notre equipe. On vous montre comment vos donnees entreraient et ce que vous en sortiriez.

Demander une demo
  • Sans engagement
  • Avec vos données
  • Dans votre langue

Le déroulé de votre session

  1. 01 Vous nous dites ce qu’on vous demandeClients, auditeurs ou banques : quelles données et pour quand. 0–5 min
  2. 02 Nous montrons comment vos données arriventFactures, ERP, fournisseurs : sur un exemple proche du vôtre. 5–20 min
  3. 03 Vous repartez avec un planQuoi automatiser en premier et combien de temps vous gagnez. 20–30 min
Avec une personne de l’équipe qui vous accompagne ensuite