
We know that waste reporting can be… a waste of time 😅.
That’s why we’ve built a dynamic pivot table that lets you cross-reference, filter, and visualize your waste management data with total flexibility.
Feel always ready with your data
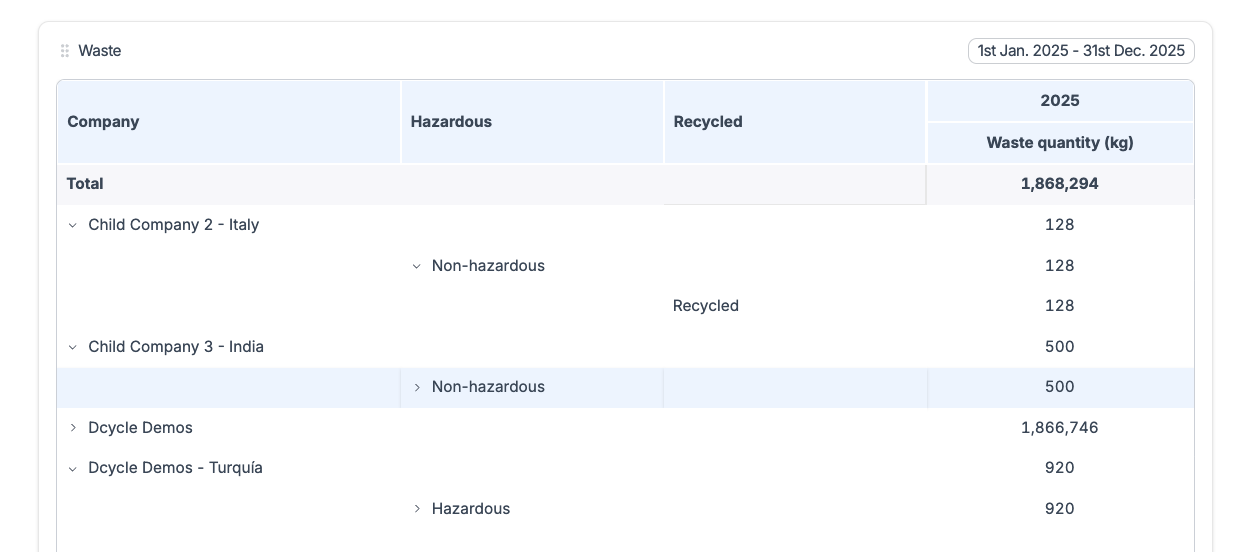
📈 Configure it once, exploit when you want 📥 What you see is what you get → Download to Excel exactly as shown in the table. 🤝 Share with zero friction → Send the file ready for audits or reports. ⚡ Always up to date → Connected to your records in real time.
Compliant with:
ISO 14001·CSRD·EcoVadis·Internal reporting
It’s already available in your account. Prepare the visualisation in your **project and share the results!. **What used to take hours is now just a couple of clicks. 🚀
Let us know how you get on — we’d love to hear your feedback so we can keep improving 🙂