Unified fuel consumption in pivot tables
Dcycle pivot tables now include a new category: fuel consumption. You can explore and analyze all the fuel your organization uses, across both fixed facilities and vehicle fleets, from one place.
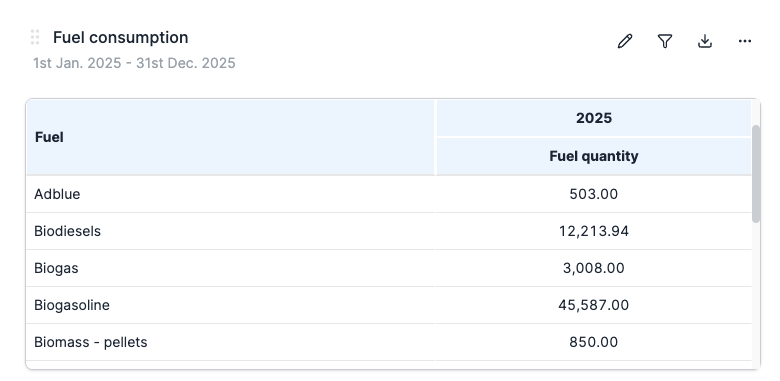
What this category includes
The category consolidates two data sources that previously had to be analyzed separately:
- Stationary fuel: consumption recorded in heat invoices, such as natural gas, biomass, or heating oil in boilers and fixed installations.
- Mobile fuel: consumption recorded for vehicles in your fleet, such as diesel, petrol, or liquefied gas. You can break down data by fuel type using the fuel unit hierarchy dimension, making it easy to compare consumption across different energy vectors. You can also filter by source type to view stationary and mobile consumption independently.
How to access it
In pivot tables, available across all your projects, select the Fuel consumption category, choose the Fuel quantity measure, and add the dimensions you need, such as fuel type, source, or time period. Data is automatically prorated on a monthly basis to accurately reflect billing periods.
Why it matters
Fuel is one of the most significant emission sources for many organizations, both in terms of Scope 1 impact and associated costs. Having a unified view of consumption, regardless of whether it comes from facilities or vehicles, makes it easier to take action to reduce energy use and advance toward decarbonization goals.
With this new category, you can identify which sources or facilities consume the most fuel, spot trends over time, and evaluate the impact of energy efficiency measures, all within the same analytics tool you already use for the rest of your sustainability data.