
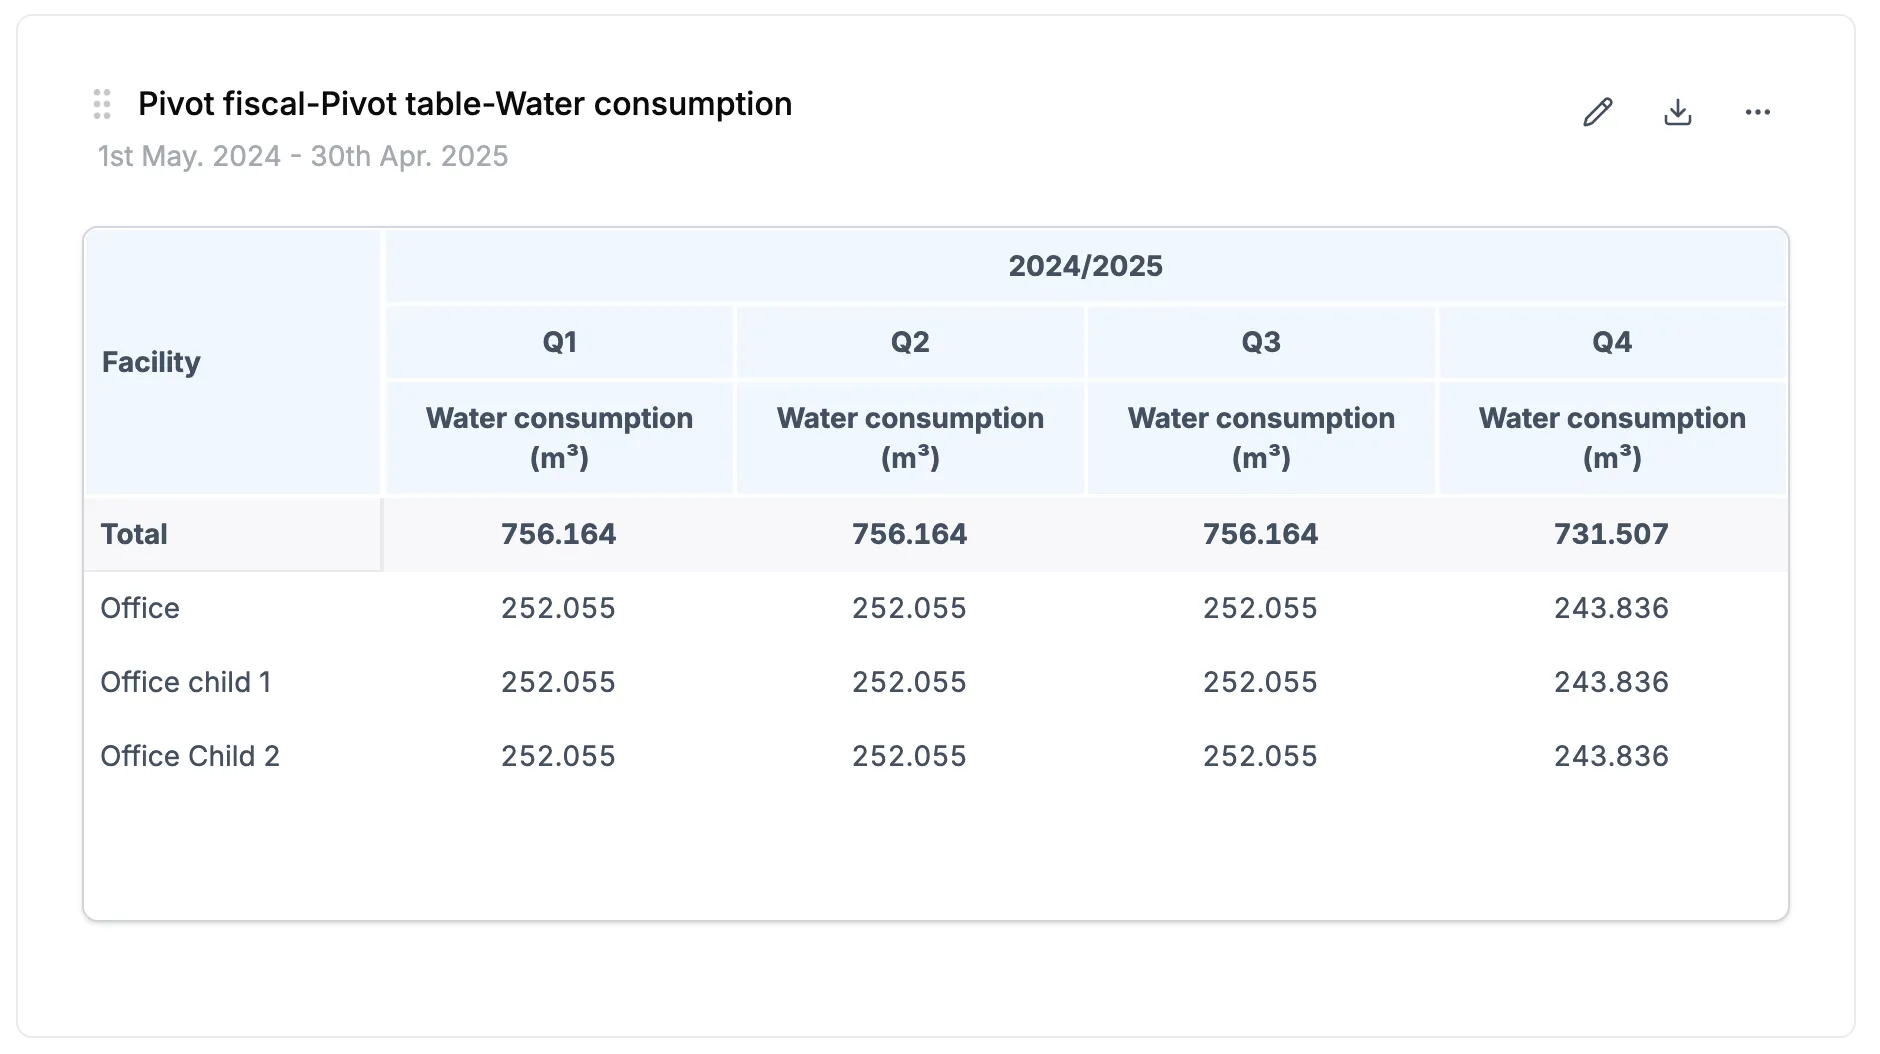
Introducing fiscal year grouping in dashboard pivot tables.
Many organizations operate on a fiscal year that doesn’t align with the calendar year. Until now, pivot tables only grouped data by calendar year, quarter, and month. With this update, you can switch between natural year and fiscal year directly from the configuration panel.
How it works
- When configuring a pivot table, you’ll find a new “Year grouping” selector where you can choose between “Natural year” and “Fiscal year”
- Years are displayed in fiscal format (e.g., “2024/2025”)
- Quarters and months automatically adjust based on your fiscal year start month
- All data categories are supported: energy, water, waste, carbon footprint, training, employees, accidents, and purchases
Note: The selector only appears if your organization has a fiscal year start month other than January (Click in your profile > Company settings > Fiscal information). If you don’t see it, contact your administrator to configure it.