
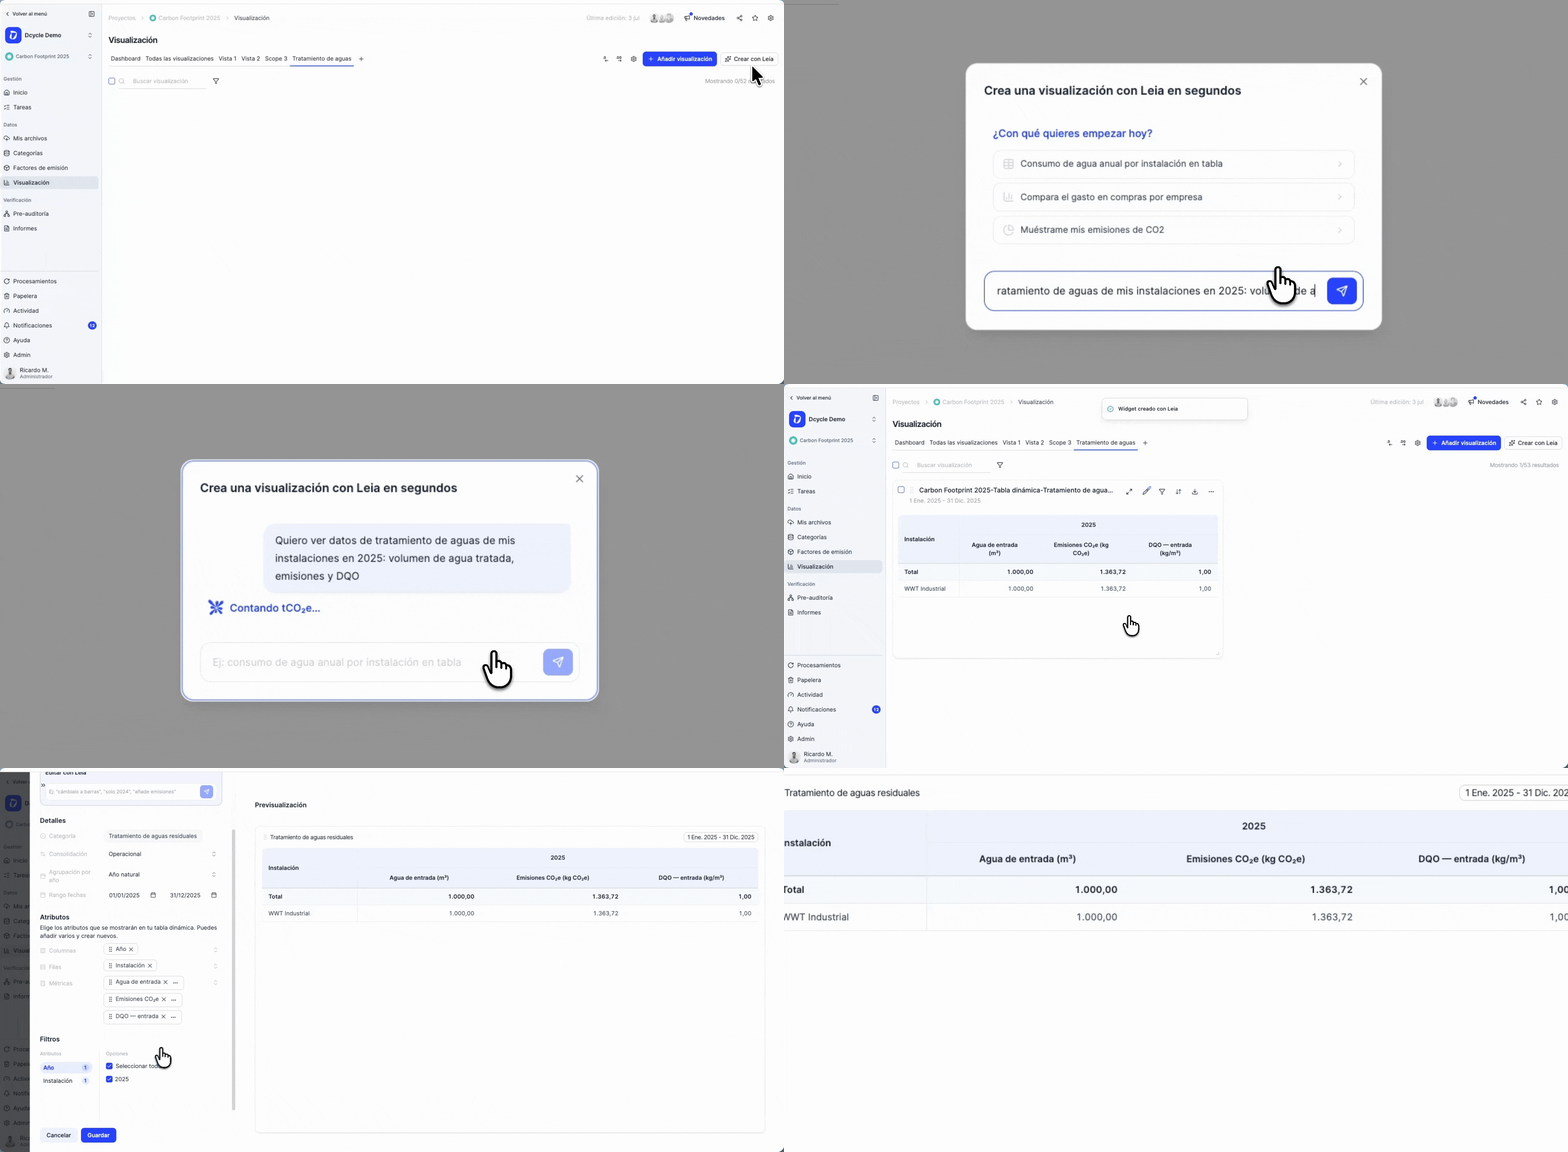
You can now build pivot tables and visualizations from your waste water treatment (WWTP) data, right alongside energy, water and carbon footprint.
Open the Visualization tab of any project, add a pivot table, and pick the new Waste water treatment category to slice your treatment-plant data any way you need.
What changed?
- New “Waste water treatment” category in the custom-dashboard pivot builder.
- 11 measures: CO₂e emissions, influent water (m³), discharged water (m³), sludge evacuated, biogas (recovered CH₄), plus BOD and COD organic-load ratios for the influent, sludge and discharge lines.
- Correct aggregation by design: volumetric measures (m³, kg, CO₂e) are summed and prorated across the period; the BOD/COD ratios are shown as a per-record mean, so the totals row averages intensities instead of adding them up.
- Break it down by water type (Domestic / Industrial), treatment name, facility, company, country, and year / quarter / month.
- Operational and financial consolidation: the financial view weights the volumetric measures by ownership %, while the BOD/COD averages stay as averages.
- Export to Excel and to a flat dataset, with fully translated headers and values.
Available now
It’s live for everyone, no setup needed if your facilities already have waste water treatment data. Just go to a project’s Visualization tab → Add visualization → Pivot table → Waste water treatment.